
A vaguely eccentric movie director has a brilliant idea…
He envisions an online store that sells clothing for busy professionals; he thinks if he finds it difficult to build a stylish wardrobe then others must as well. “This idea has legs,” he says.
To get the ball rolling he hires Jaime Levy, an expert in user experience, who suggests they do a competitive analysis. The director is reluctant. He believes there’s nothing else out there quite like his idea. With some hesitation, he gives Jaime the green light.
Guess what? The idea wasn’t viable — the supposedly untouched niche was packed with competition fiercer than a hungry lion. Needless to say, the director wasn’t happy, but eventually, his wife dissuades him from pursuing the idea.
Jaime Levy tells this story in her instructive book UX Strategy. It’s an anecdote that succinctly captures how a competitive analysis can serve as a much-needed reality check. Now, you might think this story is an isolated example of an idiosyncratic business person with a half-baked idea.
Nothing could be farther from the truth.
A user experience researcher from Google interviewed 150 startup founders and venture capitalists. To his dismay, he discovered that 86% of startup ideas emerge from an entrepreneur’s personal pain, a group that would include our movie director.
When the founders were asked about their competition, most denied having any. Those who admitted to having rivals often declared “we do things differently” or proudly pointed to their superior set of features. Sound familiar?
The problem with this reasoning is it assumes that users view features as an end in themselves where more is better. That’s how solution-obsessed product teams think — not users.
Visitors, in large part, just want their problem solved.
We can elucidate the challenges users face with a UX competitive analysis. In this piece, we’ll discuss the what, why, and how of this technique with an emphasis on tools that facilitate the process.
What is a UX Competitive Analysis?
In the study of founders, only 12% knew what the term ‘user experience’ meant. For the sake of clarity, then, let’s define UX as it can be a rather vague concept.
Google defines user experience as, “The overall experience of a person using a product such as a website or computer application, especially in terms of how easy or pleasing it is to use.”
Their definition highlights the broad nature of UX, while also emphasizing one of its primary focuses, ease of use, sometimes called usability. We prize usability because it’s essential for a product to be useful. To this point, the Nielsen Norman Group has a formula: Usefulness = Usability + Utility.
In other words, a product offers value to users when it is easy to use and has the right features. The equation, all-though simplistic, provides a kind of recipe for user experience.
Now that we know the ingredients for UX, we can understand UX strategy: a plan for making a digital product that satisfies users and is profitable.
That’s the jargon-free definition. A more in-depth account goes into concepts like cost structure, value innovation, and customer acquisition. For our purposes, though, what’s important to understand is that a key step in developing our UX strategy is to run a competitive analysis…
Definition: A UX competitive analysis is a kind of research method that systematically compares how users experience interfaces that all address a similar need.
Put simply, we compare the UX of apps that solve basically the same problem. A few points of clarification about this definition:
- Possible Before Launch: To run a competitive analysis the interface does not yet have to exist. In fact, it may be preferable if it doesn’t. After all, a competitive analysis can reveal whether an app is worth making in the first place.
- Different From Market Research: In a UX competitive analysis we examine how well existing apps satisfy the needs of individuals. Market research, by contrast, is at a much higher level — it looks at issues related to markets like their size and growth prospects.
- Options for Testing: You can evaluate a landing page, feature, or user flow in your competitive analysis; you have options depending on your business problem.
In sum, a UX competitive analysis is a flexible technique for comparing designs that you can adapt to your use case. In this way, it’s a tool much like a hammer. We can complete any number of construction tasks with a hammer, just like we can solve any number of business problems with a competitive analysis.
Why Conduct a UX Competitive Analysis?
Let’s focus on the two uses of a competitive analysis which are most essential.
First, we can use competitive analysis to understand users’ mental models — that is, their expectations when completing tasks on a site, from checking out to finding a brand’s logo.
To find out where these expectations originate consider Jakob’s Law: Users spend most of their time on other people’s sites. That means other sites, including your competitors’, set the tone for user’s expectations for your site. We come to grasping what users have in mind when coming to our site by studying the competition.
This provides the advantage of expediting design decisions. It’s lightyears faster to take inspiration from other’s designs than to come up with your own interaction patterns i.e. ways to complete tasks. As the provocative saying goes, “Good artists copy. Great artists steal.”
Second, during the early stages of product development teams aim to clarify the problem they’re solving, and what solutions already exist. At this juncture, we can use competitive analysis to assess how likely a business idea is to succeed.
Make no mistake: this kind of evaluation is indispensable. It informs how we’re going to differentiate ourselves in a crowded market, and gives us an idea of how profitable a niche is likely to be.1 Thus, it’s often worth hiring an unbiased expert to complete a competitive analysis at this stage.
How to Run a Qualitative Analysis Using a Simple Spreadsheet
A qualitative analysis entails a direct observation, in this case, of your competitor’s site. We leverage expertise — honed from experience — to document competitors’ UX. This approach’s benefit is that it can provide rich insights — the kind that tells you why a competitor is sinking or swimming.
For this analysis, you’ll probably want to use a spreadsheet to organize your findings. Jaime Lee, the UX expert from earlier, offers a competitive analysis template which I’d highly recommend (sneak peek below).
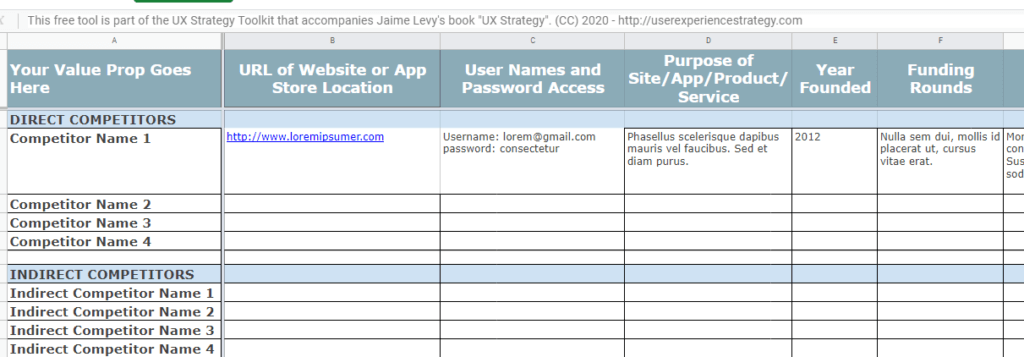
To complete an expert walkthrough involves 3 steps:
- Identify Your Competitors: There are two types of competitors — direct and indirect. Direct competitors are those who are doing pretty much exactly what you have in mind; they’re like your business doppelganger. An indirect competitor is a superficially unrelated company that satisfies the same need as your product. For instance, if a company sells ice cream online, then a shop selling cookies, satisfying the need for a sugar rush, would be an indirect competitor. Aim to identify 4 of each type of competitor.
- Fill in the Spreadsheet: If you use the template above, then be sure to adapt it because not every field will be relevant. If I had to pick the three most important fields they’d be competitive advantage, heuristic evaluation, and customer reviews (a gold mine for discovering openings in the market)
- Synthesize the Results: A bunch of data about a company’s usability, traffic, and so on is of little value unless you can synthesize the results into a concise summary. Here’s a trick. For each competitor, both direct and indirect, ask yourself: if I only had three tweets to communicate my assessment what would I say?
The value of thoroughly filling out a competitive analysis spreadsheet is best communicated with an example.
Suppose we’re evaluating the user experience of Amazon, our competitor (God help us). Immediately we’re struck by their ‘1-click’ purchasing.
Interestingly, Amazon had this feature patented for 18 years; how you get a patent for the act of pressing a button is beyond me, but I digress.

Under a competitive advantage column, we’ll add to our spreadsheet that Amazon’s UX makes it incredibly easy to make a purchase. In fact, it’s almost too easy. Our qualitative analysis should describe the risk of accidentally making a purchase.
In a column that summarizes our analysis, we’d say, “Amazon has a formidable user experience, in part, due to their 1-click purchasing. However, this feature poses a risk. For instance, it might result in an increase in customer service complaints due to accidental purchases.”
An assessment like this provides nuance by illuminating the strengths and weaknesses of a competitor’s interface. While these are rich insights, they have a weakness, an Achilles heel if you will.
They fail to account for magnitude.
Amazon’s 1-click purchasing could reduce checkout times by 50 percent or 500 percent; we won’t know until we run a quantitative analysis.2
Quantitative Analysis Overview
A quantitative analysis, broadly speaking, concerns issues of how much and how many.
A quantitative competitive analysis is no different. We’re interested in how much better or worse our user experience is when stacked up against competitors. To accomplish this we need to calculate benchmarks, metrics that encapsulate the experience offered by a product or service.
Right away I must acknowledge that creating these benchmarks is expensive. In most cases, we’re talking thousands of dollars, not hundreds.
Don’t be scared off though! If you have the budget, a quantitative competitive analysis is a tool that’s uniquely positioned to improve stakeholder decisions.
We typically run these studies at the end of a redesign as part of a summative evaluation: A high-level assessment of a design’s effectiveness.
These evaluations are best done before releasing the latest iteration of a product. That way, we can avoid hurting our brand by publishing a design that users view as decidedly worse than competitors.
The lesson is simple: before you prepare to release, compare at the least.
Amazon Versus Alibaba: A Quantitative Comparison
We have under our belts the core concepts of a quantitative competitive analysis. Let now go deeper with an example.
This time, we’re Amazon and our direct competitor is Alibaba, an e-commerce powerhouse in China. We realize that to expand into the Chinese market our user experience will need to be as good as Alibaba, if not better — after all, they have homecourt advantage.
We recruit 30 representative users to complete two tasks in random order; they must checkout on both Amazon and Alibaba. This gives us our benchmarks: we find that it takes on average 145 seconds to checkout on Alibaba and only 90 seconds on Amazon.
These benchmarks don’t tell us why Amazon’s checkout is faster, but it does tell us by how much their process is streamlined over Alibaba’s.
Does Amazon’s 55-second speed edge mean we can expand into China? Not necessarily. In fact, a faster checkout experience may be viewed as negative: Chinese culture has been significantly influenced by the Confucian tradition which emphasizes self-control, not exactly something demonstrated when making an impulse purchase in 90 seconds.
This example showcases the need to interpret quantitative benchmarks in context. Note that our approach was limited by the fact we used such a narrow metric, time to checkout. A more comprehensive strategy would be to assess the user experience holistically using a validated survey.
The User Experience Questionnaire (UEQ)
The UEQ is a 26-item survey which takes 3-5 minutes to complete. Despite its brevity, usability scholar Martin Schrepp has demonstrated it’s a valid and reliable measure of user experience.
You can use this underappreciated scale in a competitive analysis. Have at least 30 participants complete a realistic task with your product, and competitors, then fill out the UEQ to describe their experience.
The survey assesses the different facets of an interactive product’s experience. Below is a diagram depicting the structure of the UEQ:

Broadly speaking, we can break the scale down into three broad categories.
- Attractiveness: A global evaluation of the user’s experience that concerns the degree to which they liked or disliked the experience.
- Pragmatic: Another subscale which captures the learnability, efficiency, and dependability of the product (generally what we think of as usability).
- Hedonic: A subscale that assesses the level of novelty and stimulation a product offers — these are the ‘intangibles’ that are difficult to capture with anything other than a survey.
Beyond assessing the core elements of the user’s experience, the UEQ has three other additional standout qualities.
First, there’s a short-form version with only 8 items. The average of these items only differs by 0.15 from the mean of the full scale. In other words, the 8-item version provides values close enough to the long-form measure to make it practical. For instance, a researcher might use the short version to reduce participants’ fatigue when assessing multiple products. Alternatively, they could place the short-form scale on the thank page of an e-commerce site.
Second, for both the short and long-form scale there are publicly available benchmarks, scale scores averaged across hundreds of diverse products. You can determine how your product stacks up against competitors using these norms.
In fact, there are even benchmarks for specific niches such as business applications, webshops, and mobile applications — one caveat though, researchers based these industry-specific norms on smaller samples so they may be less reliable.
Third, the UEQ has a key performance indicator (KPI) add-on. It consists of 6 questions tacked onto the UEQ which assess the importance of its 6 subscales. This addition enables researchers to calculate an elegant and easy-to-interpret UX KPI.
The metric is based on the following idea: the value users place on different aspects of their experience varies by industry and product.
For instance, as Amazon, we might administer the UEQ and find out that the hedonic quality of our site seems inadequate.
It’d be tempting to pull the product design fire alarm and a crusade for a massive overhaul of the site’s aesthetic. But we’d be making a mistake. Suppose users deem Amazon’s pragmatic value as more important than its hedonic value. In that case, a subpar aesthetic experience may be more acceptable than it seems.
The takeaway? Don’t jump to conclusions about usability metrics. We can dodge this misstep by using the UEQ KPI and weighting scale scores by their importance.
The UEQ Competitive Analysis Tool
Despite all the advantages of the UEQ, it can still be expensive and time-consuming to administer.
To remedy this I created the UEQ Competitive Analysis Tool. It’s a free spreadsheet that lets you systematically evaluate your product’s usability, and competitors, using the UEQ.
Here’s how it works.
You fill out either the UEQ short or long-form for your product. It’s optional to complete the scale for your competitors since I included the publicly available benchmarks.
The result is a chart like this:

It’s helpful to share this chart with stakeholders, especially if you can thoughtfully explain your ratings.
The tool is limited in that your expert estimates may differ from the values a user would provide. After all, you’re not your user.
That said, the tool works well as a quick and free starting point. It can help teams make smart decisions when planning future research and designs.
Here are links to the short and long version of the UEQ Competitive Analysis Tool.
What Method Should I Use?
We covered a lot so far, from the why to the how of UX competitive analysis. Let recap with some general recommendations:
- Just Starting: Conduct an in-depth qualitative competitive analysis using a spreadsheet. Take your time on this because, again, it’s crucial for determining the viability of your project.
- Further Along in Product Development: Go with a quantitative UX competitive analysis if you have a clear business problem, a large budget, and at least one member of your team that is savvy with statistics.
- Strapped for Time: Give the UEQ Competitive Analysis tool a shot. Notice where you are strong and weak relative to the competition and generate a strategy for improvement.
These are merely suggestions, and which test is best for you will depend on your unique product, team, and industry. One factor to consider is opportunity cost: The money and time spent doing a competitive analysis may be better spent on paying developers or using a different research method altogether.
Conclusion
UX competitive analysis is often overlooked. There’s a tendency to believe that if one doesn’t consider the competition they’ll just go away. It’s the classic head-in-sand approach. This all-too-common mindset shows how easy it is to feel intimidated by seemingly unassailable competitors.
Alternatively, one might feel so confident their product is a winner that a competitive analysis seems about as useful as wrapping paper. That mentality sounds like our eccentric movie director.
We need to avoid these extremes of hubris and self-doubt.
Instead, we ought to keep a level-head and systematically assess who and what we’re up against. In doing so, we can embrace what the Interaction Design Foundation calls a comparative mindset: the tendency to learn from others’ designs, even outside of a formal competitive analysis.
In this way, you can make day-to-day engagement with digital products a kind of ongoing qualitative research. You’ll find that many business ideas have already been done, but not every one — far from it.
There’s a world of opportunity if you know how to piece together the puzzle that’s UX.
Top Takeaways
- UX Competitive Analysis: A method that compares the experience offered by a product to competitors. This technique aids in understanding users’ mental models and figuring out whether a business idea is viable.
- Two Types of Analyses: Use a qualitative analysis if want to understand why your competitors’ designs succeed or fail. Run a quantitative analysis if you have the funds to explore how much better or worse your UX is than competitors.
- The User Experience Questionaire: A validated survey that assesses a user’s experience holistically. There’s are short-form, benchmarks, and a KPI add-on.
- The UEQ Competitive Analysis Tool: A cross between an expert review and a quantitative study; it provides a quick snapshot of the usability of your product relative to competitors.
Endnotes
1When there are competitors there are substitutes. That is, any product or service, besides yours, that a consumer could use to meet their needs. For instance, a substitute for an expensive gym membership would be a yoga mat and some exercise DVDs.
To paraphrase the often-cited business scholar Micheal Porter: the presence of substitutes is a threat to almost any business. A sufficiently satisfying substitute can lead profit margins to shrivel as consumers opt for the better, cheaper, and faster alternative.
2 One might argue that there would be no need to quantify time to checkout with 1-click purchasing because it’s self-evidently instant. However, that fails to take into account the ‘front and backend’ of the checkout process.
Ironically, 1-click purchasing may slow some users’ checkout because the gravity of pressing a button and having their card charged creates hesitation. On the backend, a user might want to check that their order was properly filled out before feeling their checkout is complete.
Just because a feature sounds like it would reduce all friction, doesn’t mean it actually will.
References
Why You Should Analyze Your Competition to Design Better Solutions and How to do it
Constructing Benchmarks for the User Experience
Construction and Evaluation of the User Experience Questionaire
Competitive Usability Evaluations: Learning From Your Competition
Developing a UX KPI based on the user experience questionnaire
Summative Versus Formative Evaluations
Google I/O 2014 – Don’t Listen to Users, Sample Their Experience!